What Actually Wins NHL Games? It’s Not What You Think
As the NHL season goes on, I keep hearing the same things over and over again.
Win the shot battle. Stay disciplined. Win special teams.
It sounds right. It feels right. And if you watch enough hockey, it almost becomes accepted as fact. And with the amount of times someone (perhaps a more traditional analyst) has talked up discipline, there was only one thing to do.
And that is, of course, to test it.
What I Did
I ran a regression using team-level NHL data (from the 2024-2025 season) and tested the metrics that come up constantly in broadcasts:
Shots per game Shots allowed per game Save percentage Power play percentage Penalty kill percentage Penalty minutes (for and against) PDO (a proxy for efficiency/luck)
The goal was simple: figure out what actually predicts team success.
The Process
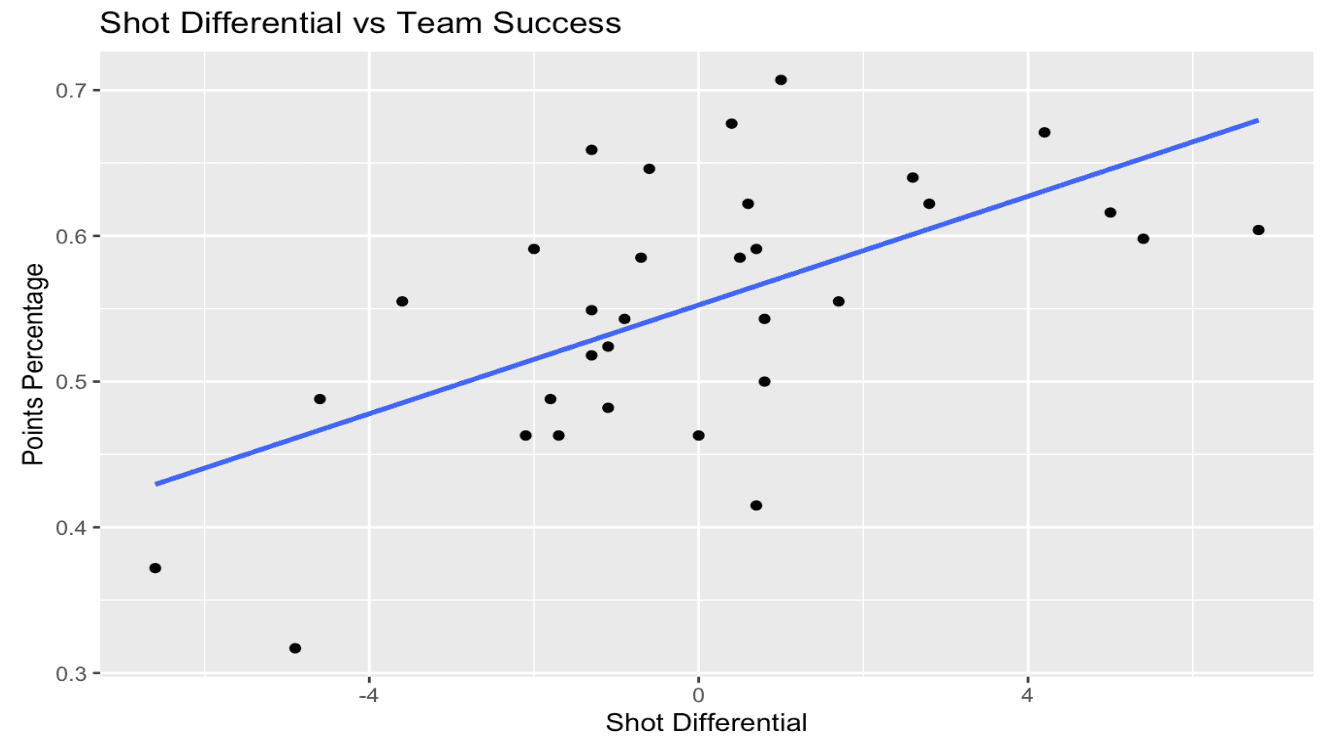
Step 1: Start simple - shot volume
I started with the most basic idea in hockey:
Outshoot your opponent, win more games.
What I found was… not quite that simple.
Shots allowed per game was highly significant. Shots taken per game had much less of a correlation.
Essentially, the model predicted that a shot against is 2 times worse for winning percentage than a shot for is good for winning percentage.
So right away:
Preventing shots matters. Taking more shots? Not to the same extent - so far. That's not to say it's entirely insignificant right now (at the end of the day, you have to shoot to score), but it does tell us that perhaps the differential of your shots vs. shots allowed is what really tells the story, as this was quite significant (congrats traditionalists, you win this one). Yet, something tells me there's more to this story.
Step 2: Add goaltending
Then I added save percentage.
This is where the entire model flipped.
Save percentage became by far the strongest predictor of winning.
One thing that really stood out was how much the shot variables changed once I added save percentage.
In the initial model, shots allowed looked far more important than shots taken (remember, about twice as impactful). But after controlling for goaltending, that gap essentially disappeared.
What’s happening here is that shots allowed were originally capturing two things at once: how well a team defends, and how well their goalie performs. Once I separated those out, the model became much clearer.
Shots allowed still matter, but now they represent pure defensive structure, limiting opportunities. And save percentage captures what happens after those opportunities occur.
And just like that, the model’s explanatory power jumped from about 38% → 83%.
That is a massive jump.
At this point, the story starts to shift:
Hockey might not be about generating offense. It might actually be about stopping it.
Step 3: Special teams
Next, I added power play % and penalty kill %.
Nothing.
Neither was statistically significant. They barely moved the model at all.
Which is honestly shocking.
If you listen to a broadcast, special teams feel like everything.
But here:
Once you control for goaltending and defense, special teams don’t independently drive winning. It becomes clear that special teams is more of a driver for action to occur, and with teams generally being around the same level throughout the league, it's often not the difference maker over the course of a season.
Step 4: Discipline
Then I added penalty minutes (both taken and drawn).
Again… nothing.
No statistical significance. No real relationship with winning.
So now two major “keys to the game” are gone:
Special teams
Discipline
Don't get me wrong, the power play is an essential element of hockey, but it's not really where teams are able to find their marginal gains. That is, it's not a major separator among teams (it's rare for one team to be far better than another in these areas). So, while it might bring action, its impact on win percentage isn't much.
That leaves us with something much simpler.
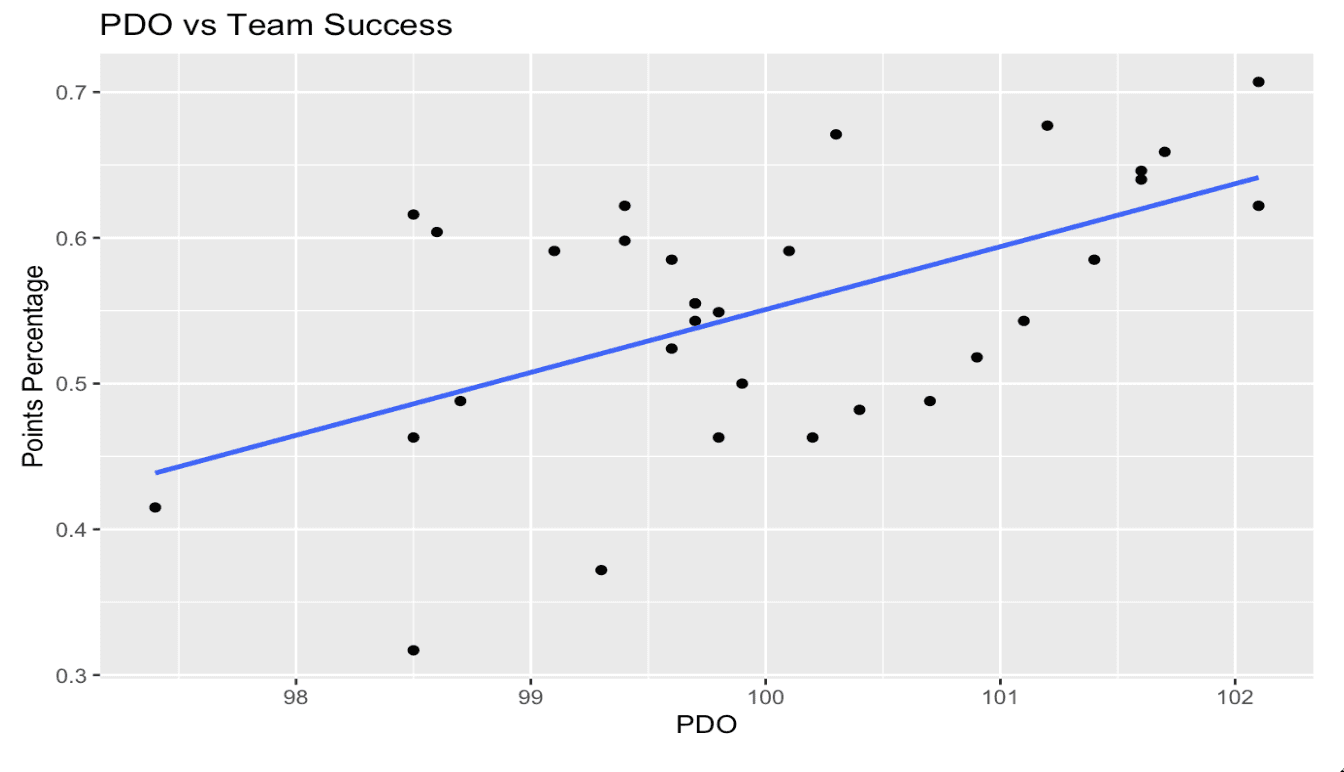
Step 5: PDO
Finally, I added PDO.
(PDO ≈ shooting % + save %, often used as a proxy for luck or finishing efficiency)
Now things got interesting.
PDO came in as statistically significant. Save % was still strong, but less dominant.
And the model improved again.
One important nuance here is that PDO and save percentage are closely related.
PDO is partially made up of save percentage, so when both are included in the model, they are effectively competing to explain the same variation in team success.
You can see this directly in the results. Once PDO is added, the impact of save percentage drops noticeably, even though it remains significant.
This is a classic case of multicollinearity (where two variables overlap in what they capture, making it harder for the model to assign credit cleanly).
But in this case, that overlap is actually informative.
It suggests that what looks like dominant goaltending performance is partly tied up in broader efficiency, how often shots go in at both ends of the ice.
In other words, even elite goaltending doesn’t operate in isolation. It’s part of a larger system that includes finishing, shot quality, and, to some extent, randomness.
The Result
Save percentage was the strongest driver in every model. Even small improvements in goaltending translate directly into wins. If your goalie is elite, you’re going to win games. It’s that simple.
PDO came in as a meaningful factor as well. Teams that convert chances and get strong goaltending tend to outperform. But PDO also has a randomness component. Which leads to a really interesting implication:
Some portion of winning in hockey might just come down to variance (ideally limited over the 82 game season).
Insights
If you watch enough hockey, parts of this feel intuitive.
The best teams usually have elite goaltending. And when a goalie gets hot, it can completely swing a series. But what this analysis does is quantify just how important that is. It's not just important, it's dominant.
At the same time, this challenges one of the most common ideas in hockey:
That generating offense is the key. It doesn't seem to be. Once you control for goaltending and defense, shot volume fades. It’s not just about how much you shoot. It’s about what happens when the puck actually gets on net.
The Bigger Picture
Taken together, this paints a pretty clear picture of hockey.
Winning is not about volume. It’s not about balance. It’s not even really about special teams.
It’s about:
Stopping pucks. Limiting chances. And, to some extent, getting the right bounces.
And honestly, that might explain why hockey can feel so unpredictable - and with that, fun.